Nottingham's geology shifts dramatically within a few hundred metres—from the Mercia Mudstone capping the sandstone ridges to the alluvial gravels threading through the Trent Valley. We see too many borehole-only investigations miss what's happening between the logs; a buried channel or perched water table that a resistivity line would have picked up in half a day. The MASW survey pairs well when shear-wave velocity profiles are needed for seismic site classification, but electrical resistivity gives us the clearest picture of moisture variation and lithological boundaries at depth. Our VES campaigns across the Midlands have mapped dissolution features in the gypsiferous mudstones around Gotham and West Bridgford, delivering continuous depth-profiles where invasive drilling alone would leave critical gaps. For any project near the River Leen or Trent floodplain, understanding subsurface conductivity is not optional—it directly controls foundation bearing assumptions and long-term durability of buried concrete.
In Nottingham's mixed Triassic terrain, resistivity data resolves the sandstone-mudstone interface with a clarity that drilling logs alone cannot match.
Service characteristics in Nottingham
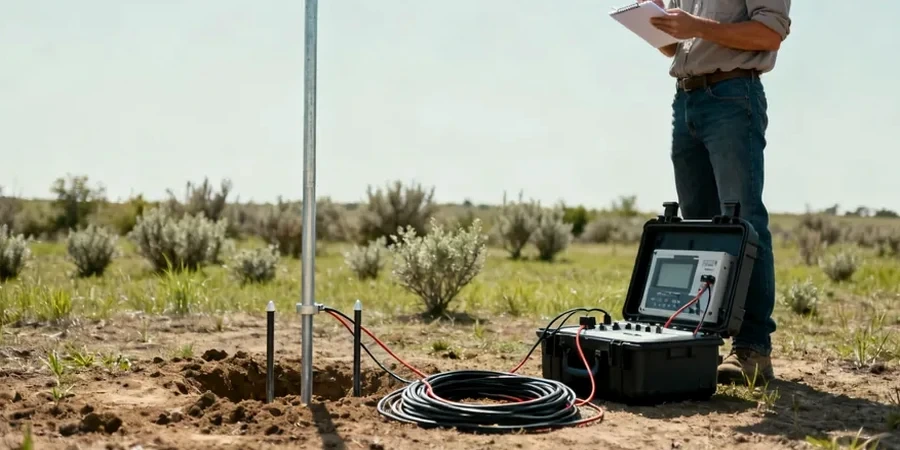
Field demonstration
Risks and considerations in Nottingham
The Mercia Mudstone across Nottinghamshire contains gypsum bands that have undergone historic dissolution, creating collapse features and uneven rockhead profiles that are invisible from the surface. Resistivity imaging is the only non-invasive method that reliably traces these low-resistivity dissolution zones before piling or excavation begins. On a recent project near Colwick, a VES line detected a 12-ohm-metre anomaly at 18 metres depth that BGS mapping had not flagged; follow-up boreholes confirmed a mud-filled dissolution pipe directly beneath the proposed pile cap location. Ignoring these features risks differential settlement, sudden loss of drilling flush, and costly re-design mid-construction. Groundwater conductivity in the Trent alluvium also varies seasonally—winter surveys often show 30% lower resistivity than summer readings—so timing the survey correctly matters for contamination plume delineation and landfill monitoring under the Environmental Protection Act 1990.
Our services
We deliver resistivity surveys in Nottingham as part of integrated site investigation packages. Each scope is tailored to the geological unit and the engineering question at hand.
Vertical Electrical Sounding
1D depth profiling using expanding Schlumberger spreads to map layer thickness and resistivity. Ideal for aquifer delineation in the Sherwood Sandstone and bedrock profiling beneath the Trent gravels.
2D Electrical Resistivity Tomography
Multi-electrode lines producing continuous cross-sections. Applied to dissolution feature detection, buried channel mapping, and brownfield site characterisation across Nottingham's former industrial corridors.
Groundwater & Contamination Mapping
Resistivity-conductivity correlation with water quality sampling for landfill monitoring and pollution plume tracking. Compliant with Environment Agency technical guidance for hydrogeological risk assessments.
Foundation & Infrastructure Surveys
Pre-construction resistivity surveys to assess ground aggressiveness (sulfate potential), estimate soil corrosivity for buried steel, and verify rockhead depth ahead of CFA piling and retaining wall design.
Common questions
How much does an electrical resistivity survey cost for a typical Nottingham site?
For a single VES sounding or a short 2D line up to 200 metres on a standard Nottingham residential plot, budget between £450 and £940. The final figure depends on line length, electrode spacing, surface access—grassland is faster than tarmac—and whether we need traffic management near city centre roads. We provide fixed-price proposals after reviewing your site plan and the target depth.
Can resistivity identify gypsum dissolution features in the Mercia Mudstone?
Yes, it is one of the most effective methods for this. Dissolution zones filled with saturated clay show resistivity values in the 8–20 Ω·m range, contrasting sharply with intact mudstone at 30–60 Ω·m. We design line orientations to cross suspected features and use tight electrode spacing for high lateral resolution.
What depth can a VES survey reach in Nottingham's geology?
With a maximum AB/2 of 200 metres using a Schlumberger array, we routinely reach 70–80 metres in the Sherwood Sandstone. In conductive Mercia Mudstone terrain, practical penetration reduces to around 50 metres. We select the spread geometry based on your required investigation depth and the background resistivity from BGS data.
How long does a resistivity survey take on site?
A single VES sounding takes about one hour including setup and calibration. A 400-metre 2D tomography line typically occupies our crew for four to eight hours, depending on terrain and the number of electrode deployments. We can usually deliver preliminary profiles within two working days of site completion. More info.